A lot of the early development of quantum mechanics focused on the hydrogen atom. Fortunately, the hydrogen atoms that are around today are just as good as the ones from the 1910’s and furthermore we’ve got the benefit of hindsight and improved instruments to help us. So let’s take a look at what raw experimental data we can get from hydrogen and use that to trace the development of ideas in quantum mechanics.
Back in 1740’s, lots of people were messing around with static electricity. For example, the first capacitor (the Leyden jar) was invented in 1745, allowing people to store larger amounts of electrical energy. Anyone playing around with electricity – even just rubbing your shoes across a carpet – is familiar with the fact that electricity can jump across small distances of air. In 1749, Abbe Nollet was experimenting with “electrical eggs” which was a glass globe with some of the air pumped out, with two wires poking into it. Pumping the air out allowed longer sparks, apparently giving enough light to read by at night. (Aside: one of these eggs featured in a painting from around 1820 by Paul Lelong). a video of someone with a hydrogen-filled tube so we don’t all have to actually buy one.
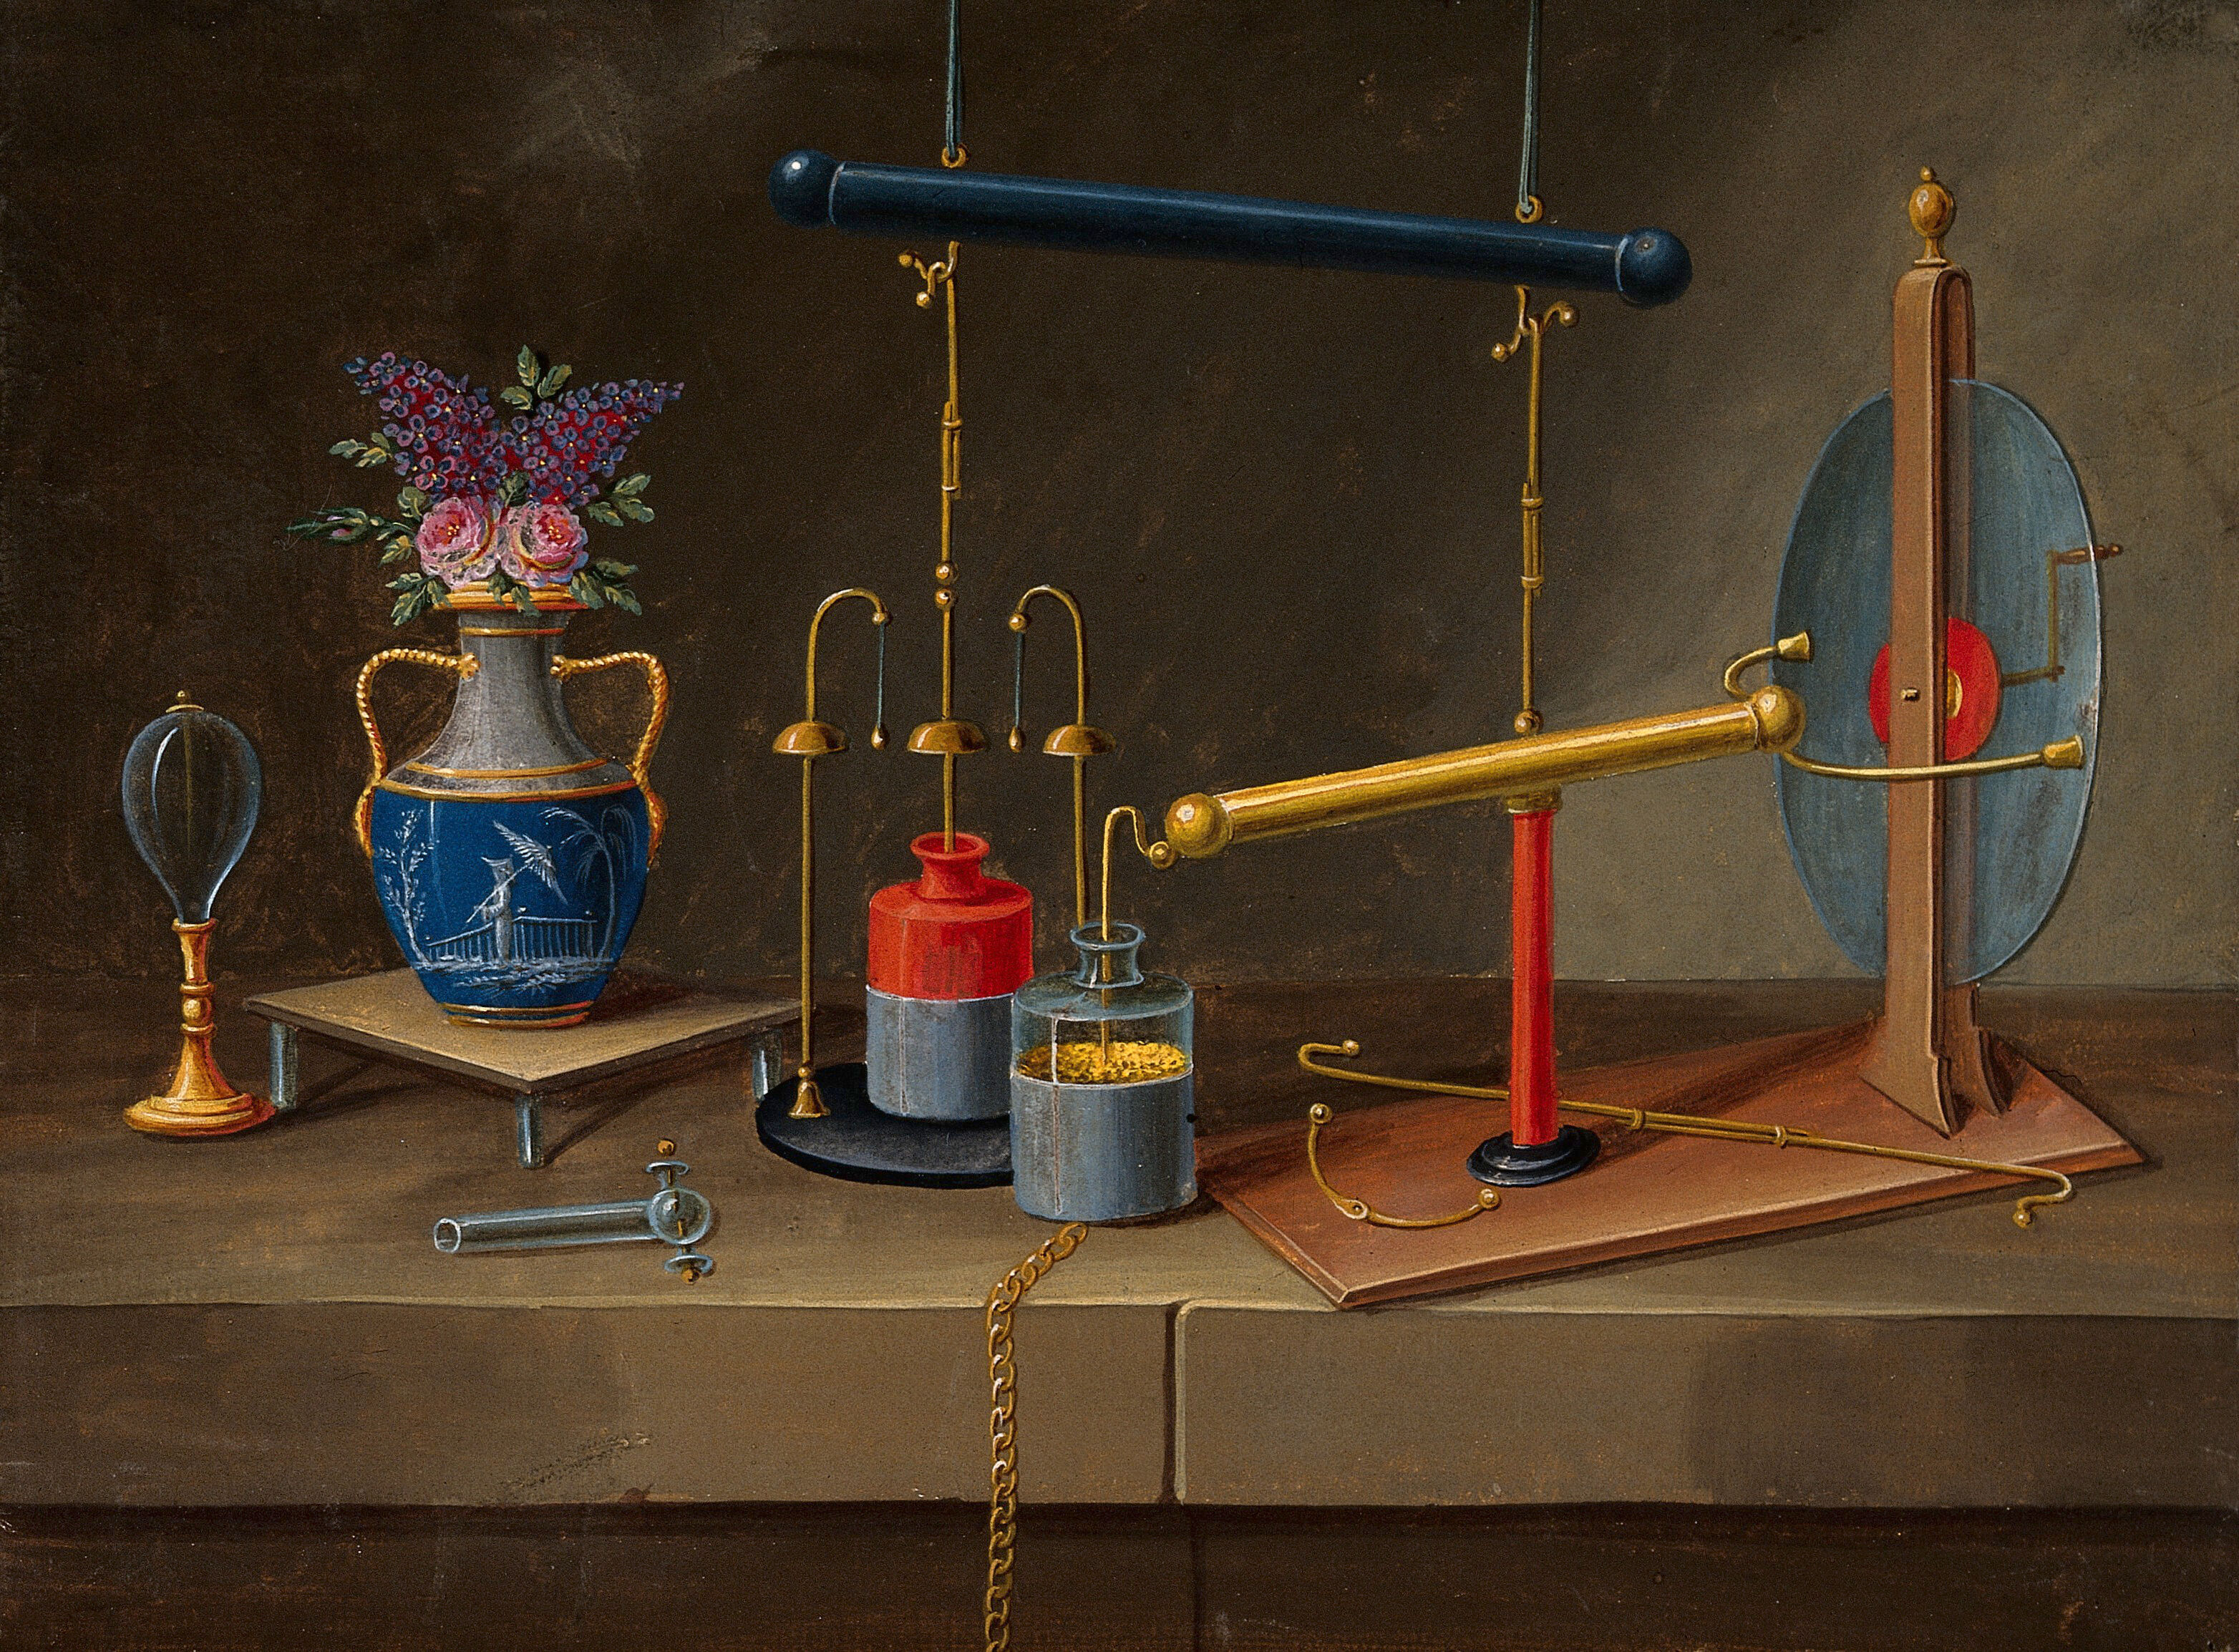
By passing the light through a diffraction grating (first made in 1785, although natural diffraction gratings such as feathers were in use by then) the different wavelengths of light get separated out to different angles. When we do this with the reddish glow of the hydrogen tube, it separates out into three lines – a red line, a cyan line, and a violet line. Although many people were using diffraction gratings to look at light (often sunlight) it was Ångström who took the important step of quantifying the different colours of light in terms of their wavelength (Kirchoff and Bunsen used a scale specific to their particular instrument). This accurately quantified data, published in 1868 in Ångström’s book was crucial. Although Ångström’s instrument allowed him to make accurate measurements of lines, he was still just using his eyes and therefore could only measure lines in the visible part of the spectrum (380 to 740nm). The three lines visible in the youtube video are at 656nm (red), 486nm (cyan), 434nm (blue) and there’s a 4th line at 410nm that doesn’t really show up in the video.
These four numbers are our first clues, little bits of evidence about what’s going on inside hydrogen. But the next breakthrough came apparently from mere pattern matching. In 1885 Balmer (an elderly school teacher) spotted that those numbers have a pattern to them. If you take the series n^2/(n^2-2^2) for n=3,4,5… and multiply it by 364.5nm then the 4 hydrogen lines pop out (eg. for n=3 we have 365.5 * 9/(9-4) = 656nm and for n=6 we have 365.5 * 36/32 = 410nm). Alluringly, that pattern suggests that there might be more than just four lines. For n=7 it predicts 396.9nm which is just into the ultraviolet range. As n gets bigger, the lines bunch up as they approach the “magic constant” 365.5nm.
We now know those visible lines are caused when the sole electron in a hydrogen atom transitions to the second-lowest energy state. Why second lowest and not lowest? Jumping all the way to the lowest gives off photons with more energy, so they are higher frequency aka shorter wavelengths and are all in the ultraviolet range that we can’t see with our eyes.
Balmer produced his formula in 1885, and it was a while until Lyman went looking for more lines in the ultraviolet range in 1906 – finding lines starting at 121nm then bunching down to 91.175nm – and we now know these are jumps down to the lowest energy level. Similarly, Paschen found another group of lines in the infrared range in 1908, then Brackett in 1922, Pfund in 1924, Humphreys in 1953 – as better instruments allowed them to detect those non-visible.
Back in 1888, three years after Balmers discovery, Rydberg was trying to explain the spectral lines from various different elements and came up with a more general formula, of which Balmer’s was just a special case. Rydberg’s formula predicted the existence (and the wavelength) of all these above groups of spectral lines. However, neither Rydberg or Balmer suggested any physical basis for their formula – they were just noting a pattern.
To recap: so far we have collected a dataset consisting of the wavelengths of various spectral lines that are present in the visible, ultraviolet and infrared portions of the spectrum.
In 1887, Michelson and Morley (using the same apparatus they used for their famous ether experiments) were able to establish that the red hydrogen line ‘must actually be a double line’. Nobody had spotted this before, because it needed the super-accurate interference approach used by Michelson and Morley as opposed to just looking at the results of a diffraction grating directly. So now we start to have an additional layer of detail – many of the lines we thought were “lines” turn out to be collections of very close together lines.
In order to learn about how something works, it’s a good idea to prod it and poke it to see if you get a reaction. This was what Zeeman did in 1896 – subjecting a light source (sodium in kitchen salt placed in a bunsen burner flame) to a strong magnetic field. He found that turning on the magnet makes the spectral lines two or three times wider. The next year, having improved his setup, he was able to observe splitting of the lines of cadmium. This indicates that whatever process is involved in generating the spectral lines is influenced by magnetic fields, in a way that separates some lines into two, some into three, and some don’t split at all.
Another kind of atomic prodding happened in 1913 when Stark did an experiment using strong electric fields rather than magnetic fields. This also caused shifting and splitting of spectral lines. We now know that the electric field alters the relative position of the nucleus and electrons, but bear in mind that the Rutherford goil foil experiment which first suggested that atoms consist of a dense nucleus and orbiting electrons was published in 1913 and so even the idea of a ‘nucleus’ was very fresh at that time.
Finally, it had been known since 1690 that light exhibited polarization. Faraday had shown that magnets can affect the polarization of light, and ultimately this had been explained by Maxwell in terms of the direction of the electric field. When Zeeman had split spectral lines using magnetic field, he noticed the magnetic field affected polarization too.
So that concludes our collection of raw experimental data that was available to the founders of quantum mechanics. We have accurate measurements of the wavelength of spectral lines for various substances – hydrogen, sodium etc – and the knowledge that some lines are doublets or triplets and those can be shifted by both electric and magnetic fields. Some lines are more intense than others.
It’s interesting to note what isn’t on that list. The lines don’t move around with changes in temperature. They do change if the light source is moving away from you at constant velocity, but this was understood to be the doppler effect due to the wave nature of light rather than any effect on the light-generating process itself. I don’t know if anyone tried continuously accelerating the light source, eg. in a circle, to see if that changed the lines, or to see if nearby massive objects had any impact.